The Wyckoff pattern is an interpretive framework for labelling a trading range as possible accumulation or distribution by comparing price movement, volume, tests of support or resistance, and the behaviour that follows. It is not a single candlestick pattern and it does not reveal who placed an order.
This guide separates the 4-part price cycle from the 5 schematic phases, defines the common abbreviations, and turns a chart label into rules that can be tested. A spring, upthrust, Sign of Strength, or Sign of Weakness is a hypothesis until the trader specifies the market, timeframe, trigger, invalidation, costs, and sample.
Richard D. Wyckoff developed the method for stocks. The same labels are now applied to other markets, but the evidence is not identical: decentralised spot-forex volume is feed-specific, futures volume is venue-based, and crypto data varies by exchange. Use the same data source in testing and execution rather than assuming every schematic transfers unchanged.
- Cycle and schematic are different. Accumulation, markup, distribution, and markdown describe the broad cycle; Phases A-E organise events inside accumulation or distribution ranges.
- Three laws organise the analysis. Wyckoff names supply and demand, cause and effect, and effort versus result.
- Composite Man is a teaching device. It asks the analyst to read coordinated-looking market behaviour as one campaign; it is not proof that one actor controls the chart.
- A label is not an entry. Define the trigger, invalidation, stop, target method, session, costs, and data feed before testing it.
- Risk rules still apply. A correct market-structure label can still lose, slip, breach a daily limit, or fail a prop-firm holding or news rule.
Where the Wyckoff method came from
Richard D. Wyckoff developed the framework while studying stock-market price and volume in the early 20th century. Modern readers often use “Wyckoff pattern” to mean the idealised accumulation and distribution schematics inside the broader method.
The method's published tutorial describes price cycles, 3 laws, trading-range events, phase labels, supply-and-demand analysis, and Point-and-Figure counts. This guide focuses on the schematic labels; it does not claim that a label identifies the next price move.
Composite Man is a model, not an observable trader
Wyckoff's “Composite Man” asks the analyst to study market action as though large interests were conducting one campaign. The device can make a sequence easier to reason about, but a chart cannot establish one actor's identity or intent. Record what price and volume did instead of presenting an inferred story as fact.
The 3 Wyckoff laws
The framework names supply and demand, cause and effect, and effort versus result. These are analytical categories rather than account rules or guaranteed signals.
The law of supply and demand
Wyckoff analysis infers the balance of demand and supply by comparing price spread, closing position, volume, rallies, and reactions over time. Rising price is treated as evidence that demand exceeded available supply at those prices; falling price suggests the reverse. The chart is indirect evidence, so the conclusion should remain conditional.
The Law of Cause and Effect
“Cause” describes activity built inside a trading range; “effect” describes the later price movement attributed to it. Traditional Wyckoff analysis uses horizontal Point-and-Figure counts to project a potential objective. A projection is a scenario boundary, not a promise that price reaches it.
The law of effort versus result
Volume represents “effort” and price progress represents “result.” High volume with little upward progress after a rally can prompt a supply test, but it does not prove distribution or an immediate reversal. The next reaction, retest, and invalidation level determine whether the interpretation survives.
The 4-stage Wyckoff price cycle
The broad cycle uses 4 labels: accumulation, markup, distribution, and markdown. This cycle is separate from Phases A-E inside the accumulation and distribution schematics. Real charts can skip an idealised event, retest a level several times, or invalidate the proposed sequence.
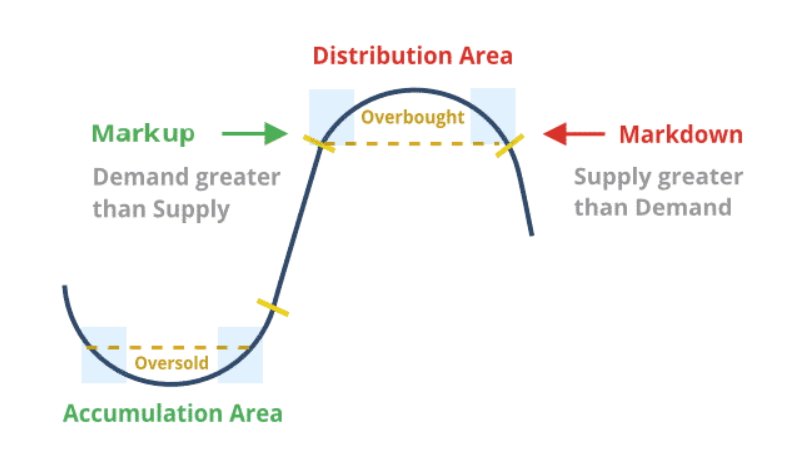
- Accumulation: a range interpreted as absorption of supply after a decline, subject to confirmation from later tests and strength.
- Markup: an advancing trend after price leaves the proposed accumulation range and demand continues to produce upward progress.
- Distribution: a range interpreted as supply entering after an advance, subject to confirmation from later weakness.
- Markdown: a declining trend after price leaves the proposed distribution range and supply continues to produce downward progress.
How to make a Wyckoff pattern testable
A schematic becomes a trading rule only after each discretionary label has an observable definition. Use this 6-step record before judging an accumulation or distribution idea:
- Fix the market and data source. Record the symbol, venue or broker feed, timeframe, session, price type, and volume source.
- Draw the range before the outcome. Save support, resistance, the proposed phase, and the event label without looking ahead to the later breakout.
- Define the trigger. A spring label alone is not an order. State whether entry requires a close back inside the range, a secondary test, a Sign of Strength, or another measurable condition.
- Define invalidation and risk. Name the price or structural event that makes the hypothesis wrong, then size from the stop rather than from the chart's apparent confidence.
- Include friction and rejected setups. Spread, commission, slippage, swaps, missed fills, and every range that failed the definition belong in the sample.
- Separate research from paid execution. Use a replay workflow first; the FX Replay review explains the tool's current editorial limitations. Then translate the tested stop and session rules into the prop-firm challenge risk-plan worksheet.
Keep one pre-entry setup label in the journal. If “spring” or “UTAD” is added only after the trade moves, it cannot distinguish planned execution from hindsight. The overtrading audit shows how to compare planned and off-plan entries across 20 sessions, while the net-cash profitability test keeps a promising chart sample separate from received payouts and paid attempts.
Wyckoff Accumulation Pattern
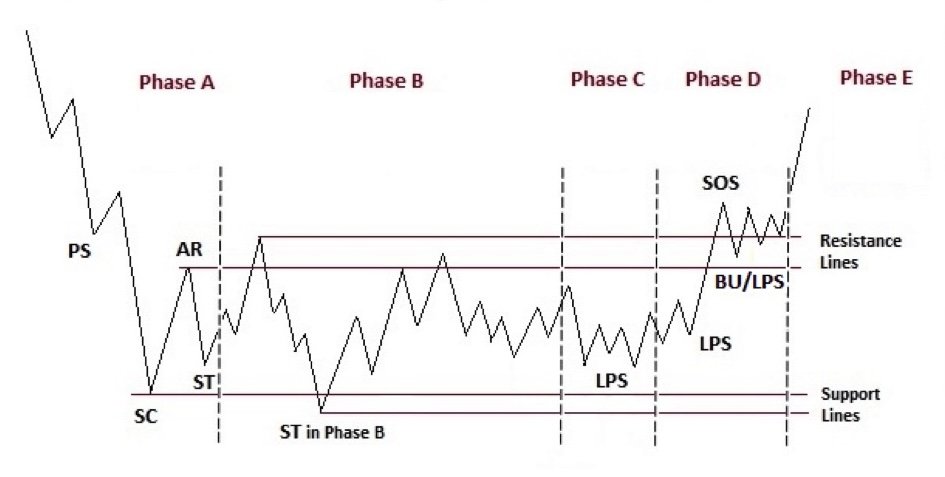
The accumulation schematic organises a possible transition from declining conditions to a range and then an advance. It contains 5 phases, A-E. Treat the event names below as labels to test, not a checklist that every range must complete.
Phase A
Phase A proposes that the prior downtrend is losing momentum and begins to define a range. Four common labels organise the observation:
- Preliminary Support (PS): the first reaction interpreted as meaningful demand after a decline.
- Selling Climax (SC): a sharp decline and expansion in activity proposed as a selling extreme.
- Automatic Rally (AR): the rebound after the proposed climax; its high helps define the range.
- Secondary Test (ST): a revisit toward the lower boundary used to compare spread, close, and volume with the proposed climax.
These labels establish a candidate range; they do not confirm that the decline is over.
Phase B
Phase B describes repeated movement inside the range while the proposed “cause” develops. Duration alone does not prove accumulation, so compare every test and upthrust with the prior observations.
- Multiple Secondary Tests (STs): repeated visits toward the lower range are compared for price spread, close, and activity; reduced downside progress can support, but not prove, absorption.
- Upthrusts at the upper boundary: price moves above resistance and returns to the range. Record the failed excursion without assigning an actor's motive.
- Wide swings early in the range: expanded spread and activity can occur while the boundaries are still being established.
- Reduced activity on downswings: less volume and downside progress on comparable reactions can support the accumulation hypothesis.
Phase C
Phase C proposes a final supply test. The common spring label requires price to move below support and recover; the recovery, later test, and invalidation matter more than the name.
- Wyckoff spring: price trades below the earlier support boundary and then closes or moves back into the range under the analyst's written definition.
Lower activity on a successful retest can support the supply-absorption hypothesis. A strong rally, labelled a Sign of Strength (SOS), adds evidence; a failure back below the range can reject it.
Phase D
Phase D is the proposed confirmation stage: price should show strength and hold higher support if the accumulation interpretation is correct.
- Sign of Strength (SOS): The price rallies with larger moves and higher volume, showing strong buying interest.
- Last Point of Support (LPS): a pullback after strength that holds above the earlier low under the selected structural definition.
- Movement within the Trading Range: The price often pushes toward the top of the range, sometimes getting ready to break out.
Phase E
In the idealised Phase E, price leaves the range and sustains a markup. A return through the breakout and support structure can invalidate that reading; “Phase E” should not be used to excuse a failed breakout.
A later range inside an uptrend may be labelled reaccumulation only if the trader defines how it differs from distribution and tests the continuation trigger. The prior trend alone does not settle the label.
Wyckoff Distribution Pattern
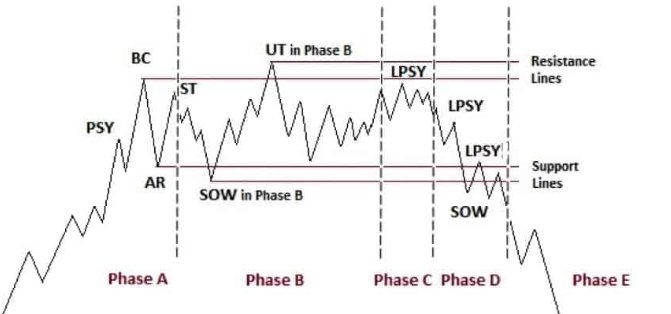
The distribution schematic organises a possible transition from an advance to a range and then a decline. It also uses Phases A-E, but the interpretation remains provisional until price demonstrates weakness and respects the proposed invalidation levels.
Phase A
Phase A marks a proposed interruption of the prior uptrend and the first boundaries of a trading range. Preliminary Supply, a Buying Climax, an Automatic Reaction, and a Secondary Test are labels for observed price-volume behaviour, not proof that distribution is complete.
Common Phase-A labels include:
- Preliminary Supply (PSY): the first reaction interpreted as meaningful supply after an advance.
- Buying Climax (BC): a sharp advance and expansion in activity proposed as a buying extreme.
- Automatic Reaction (AR): the decline after the proposed climax; its low helps define the range.
- Secondary Test (ST): a revisit toward the upper boundary used to compare spread, close, and volume with the proposed climax.
- Ending without a clear climax: an advance can lose progress without one obvious buying extreme.
- Redistribution variation: a range inside an existing decline requires later weakness before it can be distinguished from accumulation.
Phase B
Phase B describes repeated movement inside the range while the proposed distribution “cause” develops. The chart records price and volume, not the identity or position book of a seller.
Events in Phase B:
- Tests toward resistance fail to produce sustained upward progress.
- Downswings begin to cover more distance or hold lower levels.
- Signs of Weakness (SOW) can add evidence when price breaks support with expanded spread or activity.
Phase C
Phase C proposes a final demand test, often labelled an Upthrust (UT) or Upthrust After Distribution (UTAD). A move above resistance must return to the range under the written definition; the label does not identify who traded it.
Events in Phase C:
- Upthrust (UT) / Upthrust After Distribution (UTAD): Price moves above resistance but quickly falls back into the range.
- The failed breakout can invalidate long breakout rules that require acceptance above resistance.
- An entry still needs a trigger, stop, and invalidation; repeated excursions can stop a premature position.
- If demand is weak, the UT may occur at a lower high instead of the top of the range.
Phase D
Phase D is the proposed confirmation stage: price should show weakness and fail at lower resistance if the distribution interpretation is correct.
Events in Phase D:
- Tests from Phase C fail to regain the proposed resistance structure.
- Price moves or breaks through the support level of the range.
- Clear signs that sellers are in control, such as breaking support or falling below the midpoint after a UT/UTAD.
- A weak rally after a Sign of Weakness can be labelled the Last Point of Supply (LPSY) when it fails below the selected resistance.
- A return above the structural invalidation level rejects the proposed Phase-D path.
Phase E
In the idealised Phase E, price leaves the range and sustains a markdown. A recovery through the breakdown and resistance structure can invalidate that reading.
- Price breaks below the trading range on a major Sign of Weakness (SOW).
- A rally can retest the former support area; failure there adds evidence only under the pre-written trigger.
- Later rallies should make limited progress if the markdown interpretation remains valid.
- Stop changes should follow the tested management rule rather than the Phase-E label alone.
- A new range requires a fresh hypothesis; it cannot be labelled redistribution or accumulation from the prior trend alone.
What the Wyckoff pattern can and cannot tell you
The framework can give a journal consistent names for ranges, tests, strength, weakness, and invalidation. It cannot identify an institution from a chart, guarantee the next phase, remove trading costs, or prove that one feed's volume represents the whole market.
For prop-firm use, keep the market thesis separate from the account contract. Check the exact product in the challenge comparison, calculate how its loss line moves with the drawdown guide, and verify overnight and weekend permission before holding a multi-session range trade. A valid Wyckoff setup can still be invalid for the selected account.