We retail traders are the small fish in the market. No matter how many trades we place, our individual impact is almost invisible. The real market movers are the big players, often called smart money, such as institutions, hedge funds, and banks. Their decisions shape price trends, while our role is more about recognizing and following their footsteps than trying to fight against them.
The good news is, we can spot their footprints. You ask how?
Approaches like the Wyckoff pattern and other technical strategies can help us track how smart money enters or exits the market. But where does this pattern come from? How does it work?!
Keep reading this article as I explain the Wyckoff method, pattern, market cycles, rules, and much more, in plain English.
- the Wyckoff pattern comes from the The Wyckoff method, created by Richard D. Wyckoff, uses price and volume analysis to reveal the actions of smart money.
- Wyckoff introduced the idea of the “Composite Man,” a figure representing institutional players who create the market moves
- Wyckoff pattern is built on three laws: supply and demand, cause and effect, and effort versus result.
- Wyckoff explained market behavior through four main phases: accumulation, markup, distribution, and markdown
- Uderstanding the the Wyckoff pattern helps traders think like institutions, follow smart money, and avoid being trapped by false signals.
The History of the Wyckoff Pattern
When traders talk about the Wyckoff pattern, they’re usually referring to the “Wyckoff schematic,” which comes from the Wyckoff method. This method is part of technical analysis; it’s a way of studying price charts and trading volume to get a sense of where the market might head next.
The Wyckoff method was created by Richard D. Wyckoff, an early 20th-century investor and editor. He turned the behavior of big market players, what he called the “Composite Man”, into practical rules and patterns that traders could follow to anticipate the market trends.
Behind the Scenes of the Wyckoff Pattern: Wyckoff's ‘Composite Man
Based on Wyckoff's composite man theory, he believes that:
All the fluctuations in the market and in all the various stocks should be studied as if they were the result of one man’s operations. Let us call him the Composite Man, who, in theory, sits behind the scenes and manipulates the stocks to your disadvantage if you do not understand the game as he plays it; and to your great profit if you do understand it.
(The Richard D. Wyckoff Course in Stock Market Science and Technique, section 9, p. 1-2)
Wyckoff Rules: The Foundation of the Wyckoff Pattern
As we talked about earlier, Wyckoff came up with a set of rules based on the idea of the “Composite Man”, basically, the big players or smart money traders. These rules are the backbone of his method and also the Wyckoff pattern. Before we jump into the Wyckoff pattern itself, let’s get familiar with these rules.
There are three main rules: supply and demand, cause and effect, and effort versus result. Once you get these down, the whole pattern and its phases will make a lot more sense.
The law of supply and demand
It goes without saying that financial markets move based on supply and demand, and this forms the main core of trading strategies among prop firm traders, smart money, and professional traders. This foundational idea directly connects to Wyckoff’s method, which emphasizes that the balance between supply and demand dictates price movement. If demand is stronger than supply, prices go up. If supply outweighs demand, prices drop. Traders can spot this balance by studying price and volume bars, as well as the rallies and pullbacks that unfold over time.
The Law of Cause and Effect
This principle helps traders and investors set price targets by estimating how far a trend might go after breaking out of a trading range. In Wyckoff’s terms, the “cause” is the preparation or buildup, and the “effect” is the outcome that happens because of it.
You can see this law in action in the buildup of buying (accumulation) or selling (distribution) inside a trading range, and in the trend that follows, whether up or down. I’ll explain this in more detail later in the rest of this Wyckoff pattern guide.
The law of effort versus result
The law of effort versus result gives traders an early heads-up that a trend could be about to turn. When price action and trading volume don’t line up, it’s often a clue that something’s shifting. For example, after a strong rally, if you see several high-volume bars (lots of effort) but the price barely climbs any higher (little result), that’s a red flag. It can mean the big players are quietly unloading their shares, getting ready for the trend to flip.
Wyckoff Pattern Phases
As we’ve already touched on, the Wyckoff pattern is part of the broader Wyckoff method. In practice, this pattern can appear in several forms, including the Wyckoff accumulation pattern or the Wyckoff distribution pattern. These patterns help traders spot the market cycles, or phases, that Wyckoff described. To really get them, you first need to understand the four main phases: Accumulation, Markup, Distribution, and Markdown.
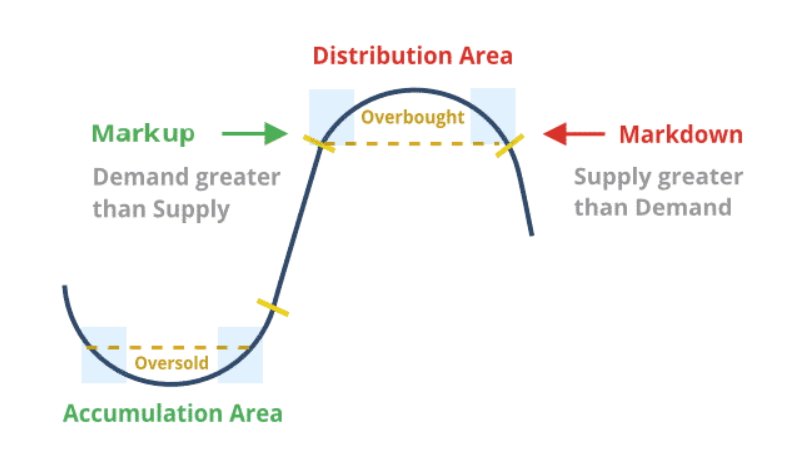
- Accumulation: This is where the game starts quietly. The Composite Man, or smart money, begins buying without pushing prices up too much. It usually happens after a downtrend, and the goal is to load up before the crowd (retail traders) catches on.
- Markup: In this phase, the Composite Man gets bolder. Prices begin a clear uptrend as demand outweighs supply. This is when the rally really starts to show itself.
- Distribution: Here, smart money starts selling to traders who are late to the party. The selling pressure from the Composite Man gets stronger, signaling that the uptrend might be running out of steam.
- Markdown: After distribution, prices drop sharply. Supply now outweighs demand, and the market moves into a clear downtrend.
Wyckoff Accumulation Pattern
So, you already know the basics of the Wyckoff method, its rules, market cycles, and how it all works. Now it’s time to check out the Wyckoff pattern, also known as the Wyckoff schematic. This shows how price and volume tend to move during the Accumulation or Distribution phases.
Let’s kick things off with the Wyckoff Accumulation pattern. It’s made up of five phases: A, B, C, D, and E, and each phase has its own set of events that shape the market’s next move.
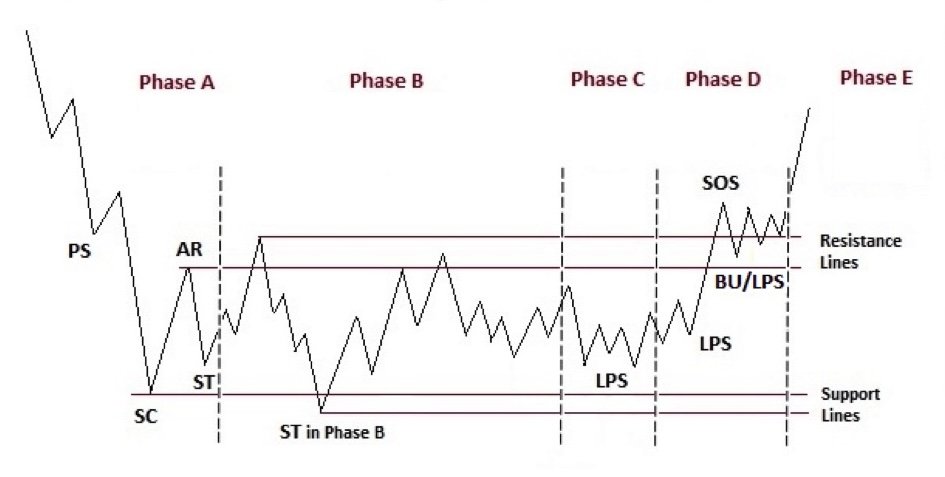
Phase A
Phase A in the Wyckoff accumulation pattern indicates that the prior downtrend is about to come to an end. There are 4 key events in Phase A, including:
- Preliminary Support (PS): First sign that selling is slowing; buyers start stepping in.
- Selling Climax (SC): The point of maximum selling pressure, often with a big price drop and high volume; large players begin buying from the public.
- Automatic Rally (AR): Price bounces up after the selling climax because selling pressure decreases and buyers push the price higher.
- Secondary Test (ST): Price revisits the SC area to confirm whether selling pressure has been absorbed; usually shows less selling and lower volume.
This phase helps traders see that the downtrend may be over and sets the stage for accumulation or the next trend.
Phase B
Remember when I explained the Wyckoff rules earlier in this guide? Well, here’s where they really help you see the big picture. Phase B is all about “building a cause” for the next uptrend. In this stage, big institutions and market pros, often called smart money or the composite man, quietly buy shares at low prices.
Phase B in the Wyckoff accumulation pattern can drag on for quite a while (sometimes over a year) because these pros are patient. They’re buying carefully and testing the market step-by-step. Here’s what usually happens during this phase:
- Multiple Secondary Tests (STs): The price dips back to lower levels within the range to check if sellers (supply) are still around. Over time, these dips often happen with less trading volume, which means the supply is getting soaked up.
- Upthrusts at the Upper Boundary: The price creates a fake breakout and then drops back down. This move helps big players test demand, shake out weak short-sellers, and trap eager buyers who think the breakout is real.
- Wide Swings Early On: At the start of Phase B, price moves can be pretty wild, and volume is high, showing that the market is being actively tested and accumulated.
- Diminishing Volume on Downswings: As accumulation continues, the supply gets absorbed. Price drops within the range start coming with lighter volume, signaling that selling pressure is fading.
Phase C
In Phase C of the Wyckoff pattern (accumulation), the stock goes through an important test to see if there’s still much selling pressure left. This is how big, professional traders, often called “smart money”, figure out if the stock is ready to move upward.
- Wyckoff spring pattern: One common move here is the Wyckoff spring pattern. This happens when the price goes below the support level from earlier phases (A and B) but then quickly bounces back. This move can fool traders into thinking the downtrend will keep going, a classic bear trap, but in many cases, it’s actually the setup for a new uptrend.
If this spring test happens with very light trading volume, it’s a sign that most sellers are already out of the way. That’s when the stock might be ready to rise, giving buyers a sweet spot to jump in. A strong rally afterward, called a Sign of Strength (SOS), often confirms that the upward phase is starting.
Phase D
If you’ve spotted the earlier phases of the Wyckoff pattern correctly, Phase D is where you finally see a solid upward trend taking shape. At this point, demand is clearly in charge, and selling pressure is fading. Here’s what usually happens:
- Sign of Strength (SOS): The price rallies with larger moves and higher volume, showing strong buying interest.
- Last Point of Support (LPS): Small pullbacks happen with low volume, meaning sellers are weak. These moments are often great chances to buy or add to a position.
- Movement within the Trading Range: The price often pushes toward the top of the range, sometimes getting ready to break out.
Phase E
This is when the stock finally breaks out of its trading range. Demand takes full control, and the uptrend becomes obvious to everyone. Pullbacks, like shakeouts or quick corrections, usually don’t last long.
In this phase, new trading ranges can form because big players are both taking profits and buying more shares. This is known as the Wyckoff reaccumulation pattern. These ranges often work like “stepping stones,” helping the asset reach even higher levels.
Wyckoff Distribution Pattern
As I mentioned earlier, the Wyckoff pattern has two main parts: accumulation, which I’ve already covered, and distribution, which I’m diving into here. To make it easier to picture, I think of it like this: during accumulation, Composite Man is acting like a patient buyer: absorbing supply until sellers are exhausted.
In distribution, it flips. Composite Man becomes a patient seller, slowly feeding supply until buyers are tapped out. Just like accumulation, the Wyckoff distribution pattern also has a few phases (A, B, C, D, and E) that I’ll walk you through next.
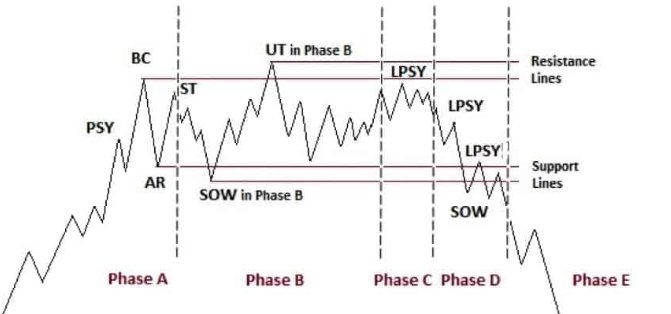
Phase A
Remember Phase A from the Wyckoff accumulation pattern? Well, the Wyckoff pattern in the distribution is basically the opposite. In Phase A of distribution, we’re looking at the end of the prior uptrend. This is when the first real signs of heavy supply show up, stopping the upward push and kicking off the trading range.
Here’s what happens in Phase A:
- Preliminary Supply (PSY): This is when we first see strong selling pressure after a long uptrend.
- Buying Climax (BC): A sharp rally on big volume, caused by demand running out and strong selling stepping in.
- Automatic Reaction (AR): A quick drop in price right after the BC, as sellers overpower buyers.
- Secondary Test (ST): Price goes back up near the BC area to check if there’s still demand, usually with lower volume and a smaller price range.
- Alternative ending (without climax): Sometimes, the uptrend just fizzles out, spreads get smaller, volume drops, and upward moves slow down before big selling takes over.
- Redistribution TR variation: In a downtrend, Phase A can look a bit like accumulation, with a big move to the downside, but the later phases still act like a normal distribution.
Phase B
Phase B of the Wyckoff pattern in distribution is when big players sell their holdings and open short positions, removing remaining buying pressure to prepare for a price drop.
Events in Phase B:
- Large traders sell shares and start opening short positions.
- Supply becomes stronger than demand.
- Signs of Weakness (SOW) often appear with bigger price drops and higher trading volume.
Phase C
Phase C is when the market tests remaining buying interest, often with a false breakout (UT or UTAD) that traps buyers and lets big players sell more before the downtrend starts.
Events in Phase C:
- Upthrust (UT) / Upthrust After Distribution (UTAD): Price moves above resistance but quickly falls back into the range.
- Acts as a bull trap to fool buyers and trigger more selling at high prices.
- Aggressive traders might short after a UT/UTAD, but repeated UTs can stop them out.
- If demand is weak, the UT may occur at a lower high instead of the top of the range.
Phase D
Phase D is when sellers clearly take control, price moves toward or below support levels, and weak rallies (LPSYs) offer prime chances to short.
Events in Phase D:
- Tests from Phase C confirm demand is nearly gone and faded.
- Price moves or breaks through the support level of the range.
- Clear signs that sellers are in control, such as breaking support or falling below the midpoint after a UT/UTAD.
- Several weak rallies happen, and the market makes a final weak rally before resuming the downtrend. It’s called the last point of supply because sellers are stepping in again to provide supply and absorb any weak demand.
- Holding long positions here is highly risky.
Phase E
Phase E is the start of the full downtrend, with supply fully in control after breaking support. Events in Phase E:
- Price breaks below the trading range on a major Sign of Weakness (SOW).
- Often followed by a small rally that fails near the old support level, another chance to open a short position.
- Later rallies in the markdown are typically weak.
- Traders in short positions can move the stop-loss level lower as the price falls.
- A sharp, high-volume drop may mark the start of another redistribution phase or a shift into accumulation.
Conclusion
All in all, the Wyckoff pattern helps you understand the full market cycle, giving you a clear view of trends and helping you anticipate where prices might be headed. This pattern comes from the Wyckoff Method, which first introduced the idea of the Composite Man to traders. The Composite Man is a metaphor for the big institutional, or “smart money,” players who drive large market moves.
Wyckoff believed retail traders should aim to think like the Composite Man: spotting and moving with his plans instead of getting tricked by them. I hope this Wyckoff pattern guide from Traders Fund Hub helps you get a solid grasp of the method and make the most of market trends and ups and downs, without getting caught off guard.